
Axial recently published an article Who’s Buying in the Lower Middle Market in 2026? Key Buyer Trends From Axial Data, where they included a table showing “Average Closed Deal TEV By Buyer Type”.
Axial did not provide any inferences related to current buyer aggressiveness, and so Calder stepped in to dissect the data and make some inferences regarding who the most aggressive buyers are in 2026. After all, if you are a seller, wouldn’t you want to know the buyer groups who are becoming the most aggressive? And if you’re a buyer, wouldn’t you want to know which groups are going to be most competitive in a bidding situation?
It is important to note that buyer “aggressiveness,” as defined in this analysis, is inferred primarily through deal size trends; specifically, we evaluated Total Enterprise Value (TEV), momentum, and recency. While larger and accelerating deal sizes often indicate stronger capital availability, conviction, and competitive behavior, they do not capture every dimension of buyer aggressiveness.
Factors such as offer structure, speed to close, diligence conditions, certainty of capital, and risk tolerance are not reflected in this dataset. As such, this framework should be viewed as a directional indicator of market behavior, not a definitive ranking of buyer competitiveness in every transaction.
How We Ranked Buyer Aggressiveness
First, when we state, “aggressive,” we are talking about qualified, well-funded buyers with acquisition mandates or inorganic growth goals, who are writing offers with the biggest checks.
Here is the raw data from Axial:
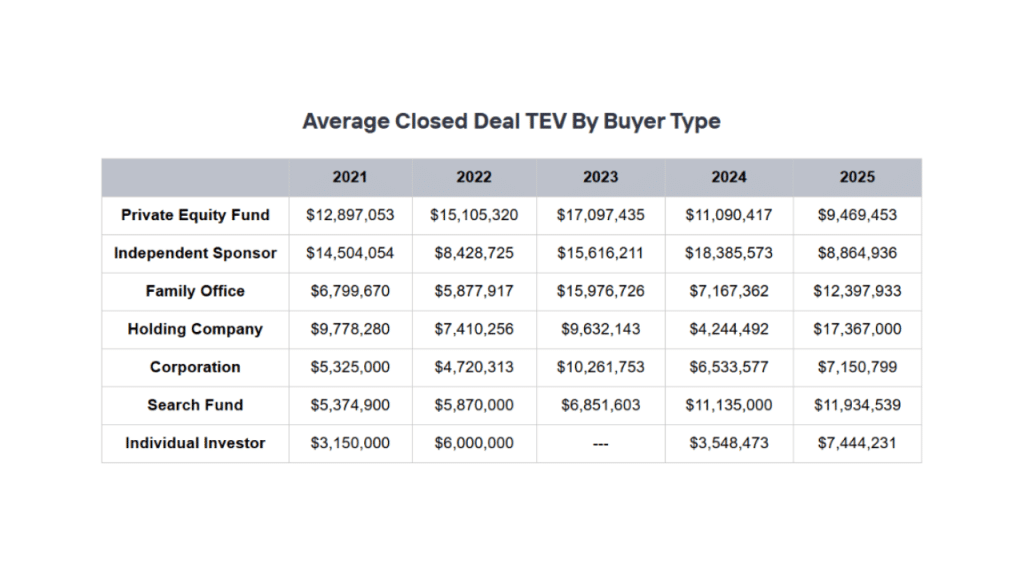
While this is helpful, the human eye tends to see a bunch of dollar values bunched together, and it’s initially difficult to infer any trends. Therefore, we analyzed the 5 years (2021–2025) of average closed deal TEV (Total Enterprise Value) they observed, across their 7 buyer types in the lower middle market. But instead of just averaging the numbers equally, we asked a different question:
“Which buyers are writing bigger checks, and where is the momentum heading?”
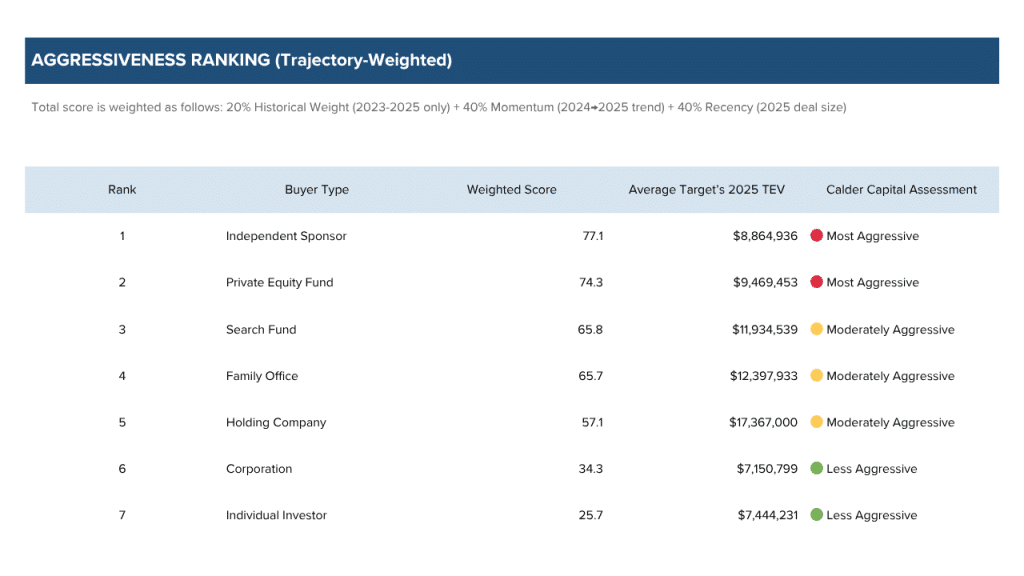
The Calder Capital Analysis
A simple 5-year average treats 2021 the same as 2025. Much has changed in the United States and the world during that time. By weighting for recency and momentum, we get a much clearer picture of who’s actually driving deal activity today and who’s just riding a reputation from years past.
Here is what our model determined:
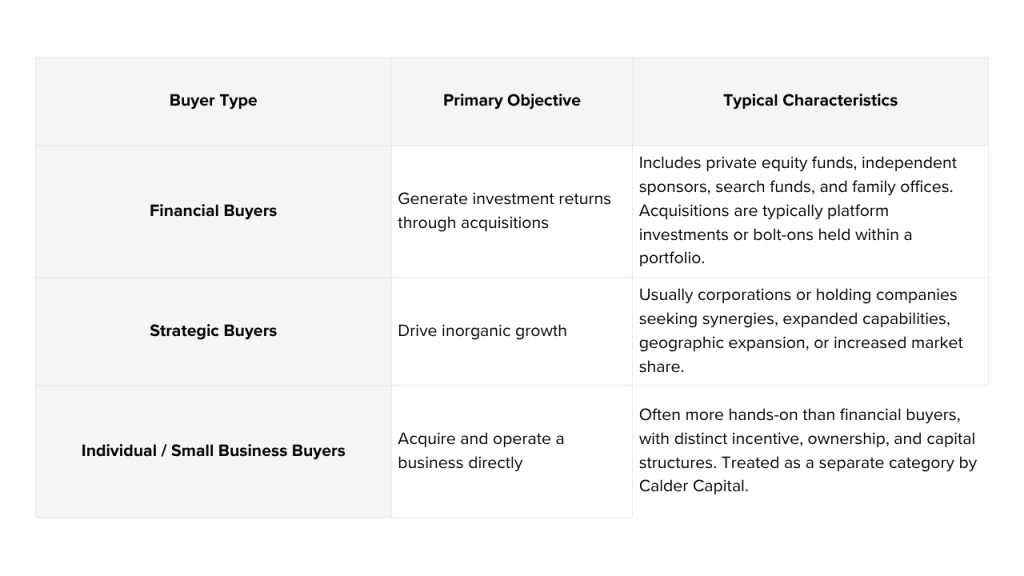
Who Are These Buyer Types?
In M&A, buyers are commonly grouped in one of two ways:
- Three categories: strategic buyers, financial buyers, and individual/small business buyers; or
- Two categories: strategic and financial buyers, with individual buyers included under financial.
At Calder, we treat individual/small business buyers as a distinct category. While some share traits with financial buyers, many are more operationally involved and differ meaningfully in incentive structures, ownership models, and sources of capital.
Most buyers referenced in Axial’s data fall under the financial buyer category, while strategic buyers are primarily corporations pursuing acquisitions to drive inorganic growth.
The Three Parts of Our Scoring Model
- Historical Average: Evaluating the last 3 years, due to material variable differences between our post-COVID economic environment and pre-COVID standards (20% of score)
We don’t use old data at all; 2021 and 2022 to get zero weight. For us, particularly in this evaluation, only the last 3 years matter. The weights we used were: 2021 = 0%, 2022 = 0%, 2023 = 20%, 2024 = 35%, and 2025 = 45%. To us, buyer who paid big in 2021 but disappeared since isn’t “aggressive” in our current environment, we view them as history.
- Momentum: Are they accelerating or fading? (40% of score)
This is one of our largest factors. For this project, we looked at the change in momentum from 2024 to 2025. A buyer whose deal sizes are growing is rewarded in our evaluation; conversely, a buyer pulling back gets penalized. For us, direction matters more than where the buyer has historically been.
- Recency: What are the size and volume of the deals that this buyer group are closing right now? (40% of score)
For this component of our report, we parced through raw deal data pertaining to 2025 deal size. If a buyer is writing $17M checks today, that speaks for itself and is more relative to sellers today, compared to what these buyer groups did three years ago.
Why Do Each of Our Three Metrics Matter?
If you’re a seller, you want to know who’s actively writing the strongest offers and consistently paying up, not who used to. There are a lot of myths in the world of mergers and acquisitions; for example, there is a myth that we actively hear, one that states that strategic buyers (corporations) pay the most. However, upon reviewing our table above, you can see that corporations, on the average, are presently among the least aggressive buyers.
When a business owner works with Calder Capital, we make all buyer groups compete for your company. This ensures the highest price, best structure, best fit, and most certainty to close for our Sell-Side Clients.
Something that we will continue to track are those buyer classes which are gaining momentum. A trend we have observed is that Search Funds jumped from #5 to #3 in recent years.
Lastly, if you’re a buyer, we recommend that you use the table above to see where you stack up. This may be a helpful tool in determining whether the market perceives your peer group as aggressive or conservative.
Our Formula
For those who are data nerds, the formula we utilized to generate our aggressiveness Score is as follows: (20% × Time-Weighted Historical Avg [2023=20%, 2024=35%, 2025=45%]) + (40% × Momentum Score from 2024→2025 % change) + (40% × 2025 Absolute TEV Score).

About Calder Capital:
Founded in 2013, Calder Capital is a cross-industry mergers and acquisitions advisory firm with offices across the United States. Calder provides valuation, sell-side, and buy-side services. We are nationally recognized for excellence in advising $1-100M enterprise value transactions in manufacturing, construction, distribution, and business services. Calder serves business owners, entrepreneurs, family offices, financial buyers, and investors. Learn more at www.CalderGR.com.
Notice: Calder Capital, LLC is not affiliated with any similarly named organizations or entities. To verify communications from our firm, visit our website or contact [email protected].